Analyzing Global Port Congestion
This project focuses on analyzing port congestion across global maritime operations to understand the operational drivers behind delays and inefficiencies in supply chains.
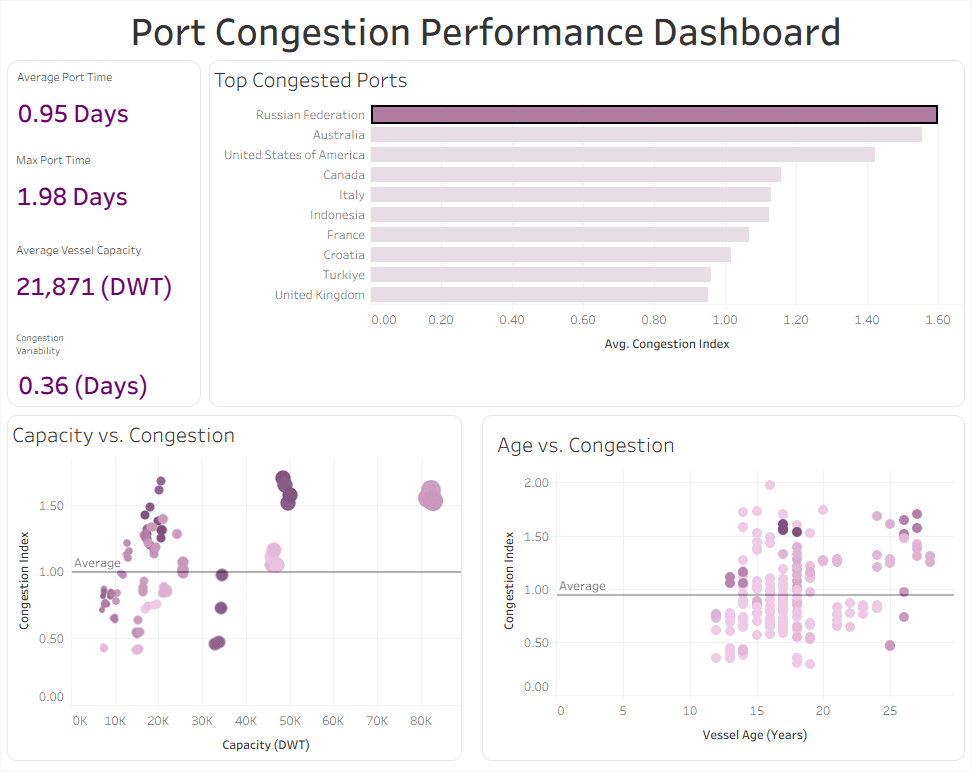
The analysis examines relationships between vessel capacity, fleet age, and port dwell time to identify key performance patterns.
Challenge
Port congestion directly impacts supply chain performance, delivery timelines, and operational efficiency. However, the root causes of congestion—whether driven by vessel size, fleet characteristics, or regional inefficiencies—are often unclear.
Without clear visibility into these drivers, organizations struggle to improve throughput and reduce delays.
Key Insights
• Larger vessels significantly increase port congestion, showing a strong correlation between capacity and dwell time (~0.54)
• Congestion varies widely across regions, indicating differences in infrastructure and operational efficiency
• Vessel age contributes to delays, but is a secondary factor compared to vessel capacity
• Congestion increases disproportionately at higher capacity levels, suggesting system constraints
0.95 Days
Average Port Time
1.98 Days
Peak Congestion
0.54
Capacity Correlation


Process
Python (Data Processing & Transformation)
Performed data cleaning, transformation, and feature engineering
Prepared dataset for structured analysis and KPI development
SQL (Data Structuring & Querying)
Executed structured queries to aggregate key metrics and performance indicators
Enabled efficient analysis of congestion patterns and operational trends
Exploratory Analysis (Pattern Identification)
Identified trends in port congestion, vessel capacity, and regional variation
Analyzed underlying patterns driving inefficiencies across global operations
Tableau (Visualization & Reporting)
Developed interactive dashboards to visualize trends and performance
Designed visuals to support data-driven decision-making
Conclusion
This project demonstrates how structured data analysis can uncover the underlying drivers of operational inefficiencies in global supply chains.
By combining Python-based analysis with Tableau visualization, the project highlights how data-driven insights can support better planning, reduce delays, and improve logistics performance.


